
Well, we did it – I was able to write at least 12 posts – even if they were just monthly performance updates! I sometimes get asked why I hold certain concentrations (i.e. mostly US), so we’ll try and add some commentary here.
Top 10 Holdings (by Market Value in C$):
| 2017 Rank | 2016 Rank | Holding | % of Portfolio | % of Portfolio (2016) |
| 1 | 2 | Intuitive Surgical Inc. (ISRG) | 13.3% | 11.9% |
| 2 | 1 | Bank of America Corp. (BAC) | 12.7% | 11.9% |
| 3 | 8 | Claymore S&P/TSX Canadian Preferred Share ETF (CPD) & BMO Laddered Pref Share Index (ZPR) |
9.8% | 3.7% |
| 4 | 4 | Berkshire Hathaway Inc. (BRK.B) | 4.8% | 5.6% |
| 5 | 12 | Mercadolibre Inc. (MELI) | 3.8% | 2.7% |
| 6 | 9 | Mastercard Inc. (MA) | 3.7% | 3.6% |
| 7 | N/A | Amazon Inc. (AMZN) | 3.5% | N/A |
| 8 | 18 | Apple Inc. (AAPL) | 3.2% | 2.1% |
| 9 | 7 | Extendicare Inc. (EXE) | 3.1% | 4.3% |
| 10 | 13 | Visa Inc. (V) | 2.8% | 2.6% |
Looking at the top 10, the first thing that strikes me in 2017 is that I actually held onto companies. Last year, there were 3 new investments that I didn’t even own in 2014.
- Intuitive Surgical Inc. (ISRG) – I have been a forever fan of the robotic surgery manufacturer and luckily decided to add more to our holdings at the beginning of the year. While the company is firing on all cylinders at double digit growth rates, we’re still looking out for worldwide adoption.
- Bank of America (BAC) – Financials, especially this one, struggled mid-2016 only to rebound nicely after the Trump election, and finally broke out of a trading range near the end of the year. We’ve taken steps in the new year to already lock in some of those gains but still stay invested for additional upside as interest rates continue to rise.
- Claymore S&P ETF (CPD) & BMO Laddered Preferred Share Index (ZPR) – We made a bet big on rate reset preferred shares in the tail end of 2015 and it wasn’t looking too pretty in mid 2016 but preferreds, especially the rate-reset kind we own, have come “roaring” back (at least for a fixed income investment). The overall preferred share index has even beat out the Canadian index for 2017!
- Berkshire Hathaway (BRK.B) – We continue to hold this conglomerate which kept pace with the S&P. If and when the next correction happens, I expect the company to deploy it’s vast amount of capital to pick up bargains.
- Mercadolibre Inc. (MELI) – One of the few international companies we own but has been absolutely on fire in South America despite political and currency uncertainty. In many ways, that may be driving more use of the company’s services. Amazon (AMZN) is said to be trying to be making inroads into the continent so let’s hope the two play nicely (or we get bought out!)
- Mastercard (MA) & Visa (V) – Both of these payment processing companies didn’t do much for us in 2016, but have done well in 2017. They payment space is so large and untapped, there’s definitely room for these 2 titans. After lagging the S&P, it was nice to have a year of above average gains from both.
- Amazon Inc. (AMZN) – What doesn’t this company do? Continued explosive growth in cloud services, retail, and even a purchase of struggling grocer Whole Foods, I’m just happy I decided to ignore the fundamental part and buy into the end state story.
- Apple Inc. (AAPL) – A $600B company that grew 40%?! How ridiculous does that sound but it’s true – but with 20%+ revenue, this juggernaut makes more money than the next 7 companies combined!
- Extendicare (EXE) – This company has always disappointed, first when I hoped that they’d get a good deal when divesting its US properties; then actually using the proceeds to generate a higher dividend from new purchases. While the 5% dividend is nice, we might wind down our position as the same yield can be achieved through a REIT (real estate income trust) with more diversification.
Biggest concern from this year is how big do you let your winners get? There were some crazy gains made this year and stocks are certainly starting to look pricey. I typically don’t like to have one individual stock be more than 10% of our holdings – Bank of America we’ve already dealt with early in 2018, but the Intuitive Surgical story continues and we’re ok with a few percentage points above our threshold. Last year, we said we’d start doing a bit of hedging – and with the run-up in US stocks in 2017, it’s definitely something we’ll be more active at doing this year.
2017 Performance:
Portfolio Performance as of 31-Dec-17
| Portfolio/Benchmark | 1M | 3M | 6M | 1 YR | 2 YR | 3 YR | 5 YR | 10 YR | Inception |
| Portfolio | -1.8 | 9.0 | 11.6 | 31.6 | 19.2 | 17.3 | 21.5 | 14.1 | 13.9 |
| S&P 500 (SPY) | -1.9 | 6.7 | 7.1 | 13.1 | 10.9 | 14.0 | 18.2 | 13.2 | 12.2 |
| TSX 60 (XIU) | 1.2 | 5.0 | 9.1 | 9.6 | 15.2 | 7.2 | 8.7 | 6.7 | 6.6 |
| 70/30 SPY/XIU split | -1.0 | 6.2 | 7.7 | 12.1 | 12.3 | 12.1 | 15.3 | 11.3 | 10.7 |
| Complete Couch Potato | -0.4 | 4.2 | 4.4 | 8.4 | 8.7 | 8.3 | 8.0 | N/A | N/A |
2017 definitely made up for an under-performing 2016 where I made some rash decisions on a minor correction mid year. Buying anything in the US (the S&P returned 20% before accounting for currency) turned out to be beneficial as the economy fired on all cylinders with millions of jobs being created and company earnings growing at a double digit pace. Even looking at the Top 25 % gainers on the S&P for the year, you’d be surprised at some on the list – Boeing (BA), Alcoa (AA), Catepillar (CAT) are all large cap, old school companies you don’t expect to go up 65%+ in a year. What was also surprising was the C$ doing really well, gaining about 7% despite the US rising interest rates faster. Without this headwind, performance would have been even better.
Individual Stock Performance (in C$)
I add this section in each year, but it’s sort of silly to put boundaries on how to look an individual stock performance based on January to December time frame. One, because it’s not like I buy everything Jan. 1 and sell everything Dec. 31 but two, even just shifting out the period a few weeks or months will drastically change the percentages.
| Align Technology Inc. (ALGN) | +121.0% |
| Lumber Liquidators Holdings Inc. (LL) | +101.3% |
| Mercadolibre Inc. (MELI) | +83.0% |
| Dollar General (DG) | +75.6% |
| Shopify Inc. (SHOP) | +75.1% |
| Proto Labs Inc. (PRLB) | +67.9% |
| Sandvine Inc. (SVC) | +58.1% |
| Intuitive Surgical Inc. (ISRG) | +56.5% |
| Apple Inc. (AAPL) | +47.6% |
| Facebook Inc. (FB) | +46.5% |
| Dundee Corp Preferred Series B (DC.PR.B) | -6.5% |
| Altria Group Inc. (MO) | -7.2% |
| The Middleby Corp. (MIDD) | -7.3% |
| NuVasive Inc. (NUVA) | -21.3% |
| Aimia Inc. Preferred Series 3 (AIM.PR.C) | -21.6% |
| Tesla Inc. (TSLA) | -25.3% |
| American International Group (AIG) | -28.2% |
| Thompson Reuters Corp. (TRI) | -36.6% |
| Neulion Inc. (NLN) | -52.6% |
| CRH Medical Corp. (CRH) | -73.0% |
Portfolio Breakdowns:
Holdings by Asset Type:

The biggest complaint any portfolio manager is going to make is my portfolio isn’t very “balanced”. Arguably, the equities portion could be considered at over 75% of the portfolio (add equities, options, warrants, and ETFs).
With only 2.4% in bonds, I’m not getting very much “balance” of the supposed negative correlation between bonds and equities (stocks fall = bonds go up and vice versa). I say supposedly because with interest rates so low the past decade, the old 60/40 equities/bond recommendation doesn’t seem like it should apply. We already know that rising rates will cause bond prices to fall so in a rapidly rising rate environment (both the Federal Reserve and Bank of Canada expect 2-3 rate increases each year for the next 3 years), any safety net created by bonds offsetting dropping stock prices is sure to be wiped out by rising rates. Short term bonds (90 day to 3 years maturity), while providing about the same yield as long term bonds, don’t have the same negative correlation effect as long term bonds. When does it make sense to add bonds? To me when 10-year yields get to 4 or 5% – at that point, it makes sense to up my bond component.
Which leads us to the preferred share – an attempt at having some fixed income component in my portfolio. We’ve written numerous times about the advantages we hope to get from rate reset preferred shares as rates increase. The drawback? They don’t really have the negative correlation that long term bonds provide – and in Canada, the preferred share market is still relatively small and mostly held by retail investors (like you and me). That makes what I’m seem as the preferred share market being erratic at times – retail investors will likely exhibit more herd mentality and in that way cause these things to act more like stocks than bonds.
Holdings by Sector:
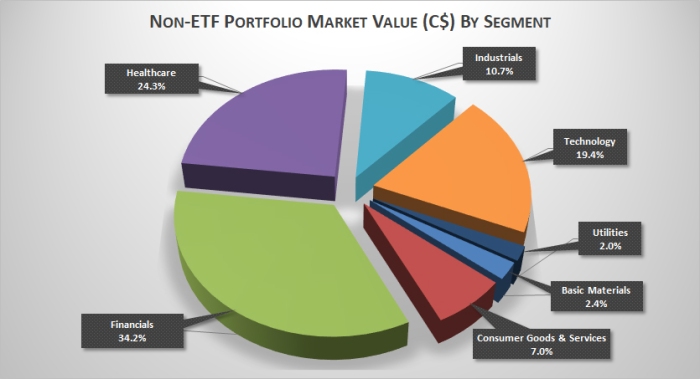
No surprises here really – based on my top holdings, 80% of my portfolio falls into financials, healthcare, or technology. Again, standard portfolio management is not to put too many eggs in one basket / industry but I’m of the mindset that you should invest in what you know – and the top 3 areas, especially some of my top holdings, I know better than other industries. Moreover, that’s what the index/ETF component of my portfolio is there for – to get a piece of the areas where I may not be so knowledgeable in.
Financials have always been a large portion of my portfolio – mostly because the past few years, we’ve been trying to capitalize on rising interest rates. It also doesn’t help that companies like Berkshire (BRK.B) and Markel (MKL) are no longer just insurance companies and own many companies outside of financials. This portion will likely get reduced a bit as our Bank of America (BAC) warrants finally play out into early 2019.
There is one area I’m looking into for 2018 – and it’s a combination of technology, consumer goods and services, and basic materials. I’ve always been fascinated with Tesla (TSLA) – maybe not always as an investor, but certainly in its vision and roadmap execution. The legacy car manufacturers have taken notice and many have decided to offer all-electric lineups within 5 years. Rather than pick which car company will sell the most electric cars (*hint*, it might not necessarily be Tesla), why not go after the rarest minerals/metals used for producing them – think Lithium, Cobalt, etc. Much like when we made our decision to invest heavily in rate reset preferred shares, this is an area I’ve been thinking might actually perform extremely well with the adoption of electric vehicles.
Holdings by Region:
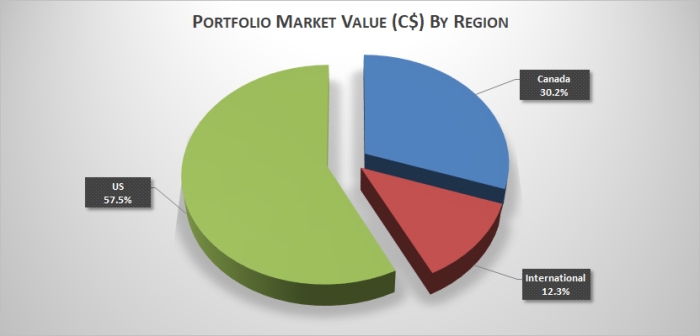
A couple of reasons why this chart is deceptive:
- Canada includes all our rate-reset preferred shares (~18% of our portfolio)
- While the US component is really high, most of our holdings perform significant business outside of the United States
I’m actually okay with how the distribution is set. If you strip out the preferred shares, maybe Canada gets a hair cut to about 10-15%. I’d like to up the international exposure and have been doing it through the year (most noticeably with investments in China), but also putting more weighting in the international ETFs/index funds when upping the index / hands-free portfolio.
A lot of people ask me why I don’t hold a lot of Canadian stocks. If there’s one thing I think Canadian financial advisors are terrible at, it’s having a home-biased view when building a portfolio. Whether it’s simpler to create, less headache for currency (although now there’s plenty of options available), or lack of understanding, it’s crazy to me why any one would want to have a significant portion invested in Canada. Don’t get me wrong – I love living here, but from an investment perspective, while Canada might have the 10th largest economy in the world, Canadian companies only make up less than 3% of all the companies worldwide. I’m not saying that people shouldn’t own Canadian stocks, but there’s a lot of missed growth opportunity if just looking at Canada alone.
Final Thoughts and Predictions:
I’m going to predict an up year for the US market – and why I continue to stay invested. Maybe not the 20% of 2017, but certainly within the 11% average of the past 50 years is possible. We all know it’s earnings that drive share prices. Despite the US market making new highs almost each week, US earnings were better than expected throughout 2017. Into 2018, earnings growth is not only projected to continue, but will get a nice 30% tail wind from Trump’s tax reform. And to pull out some new found technical analysis skills and lingo, the S&P is trading beautifully in the channel (even after this week’s roller coaster ride):

With the tremendous run we’ve had since 2009, we’ll amp up our hedging knowledge and try a few more things to get us better set for when an actual downturn occurs.
For the Canadian side, I can’t predict too much as the TSX tends to trade as commodities (think oil and gas) do. I am hoping for continued appreciation, and more dividends, of our rate reset preferred shares as the plan is for interest rates to continue rising. We might try and attempt to be smart by buying some preferred shares that reset in the next 2-4 years to max out where we think interest rates are headed, but that usually gets me into a bit of trouble.
We’ll continue to look for opportunities to up our International exposure. While international markets have gone up, not to the same degree that the US market has so more reasonable valuations exist.
I continue to be surprised at how well the CAD has done against the USD but it’s something I can’t really do much about – we’ll just hope to not experience the large swings we’ve had over the past decade; or better yet, a big drop in the loonie. From experience, it makes it really hard to get a great return when you have a 10% headwind.


Pingback: Portfolio Update – January 2018 (+8.4%, Currency -1.7%) | Fearless Cal's Investment Journal
Pingback: Portfolio Update – January 2018 (+8.4%, Currency -1.7%) – Fearless Cal's Investment Journal